In the ever-evolving world of ecommerce, understanding your customers’ behavior is key to unlocking greater sales and improving user experience. While traditional analytics provide valuable data on traffic and conversions, heatmaps offer a unique, visual perspective that reveals exactly how visitors interact with your website. By tracking clicks, scrolls, and mouse movements, heatmaps help you identify what captures attention, what causes friction, and where customers may be dropping off. In this blog post, we will explore how leveraging heatmaps can transform your ecommerce strategy, enabling you to make data-driven decisions that boost engagement, optimize layouts, and ultimately drive success.
1. What Are Heatmaps and Why They Matter in Ecommerce
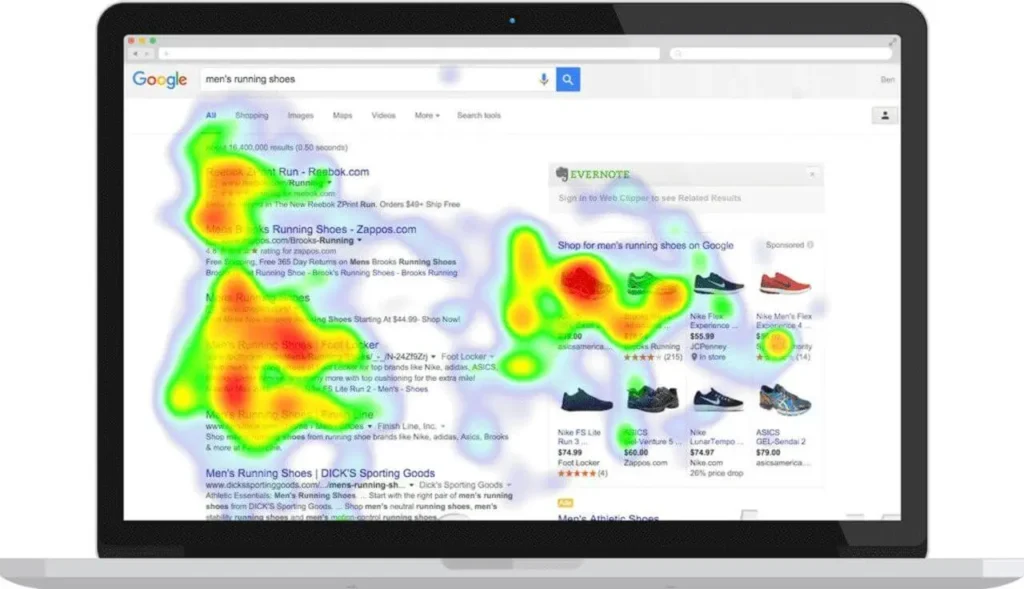
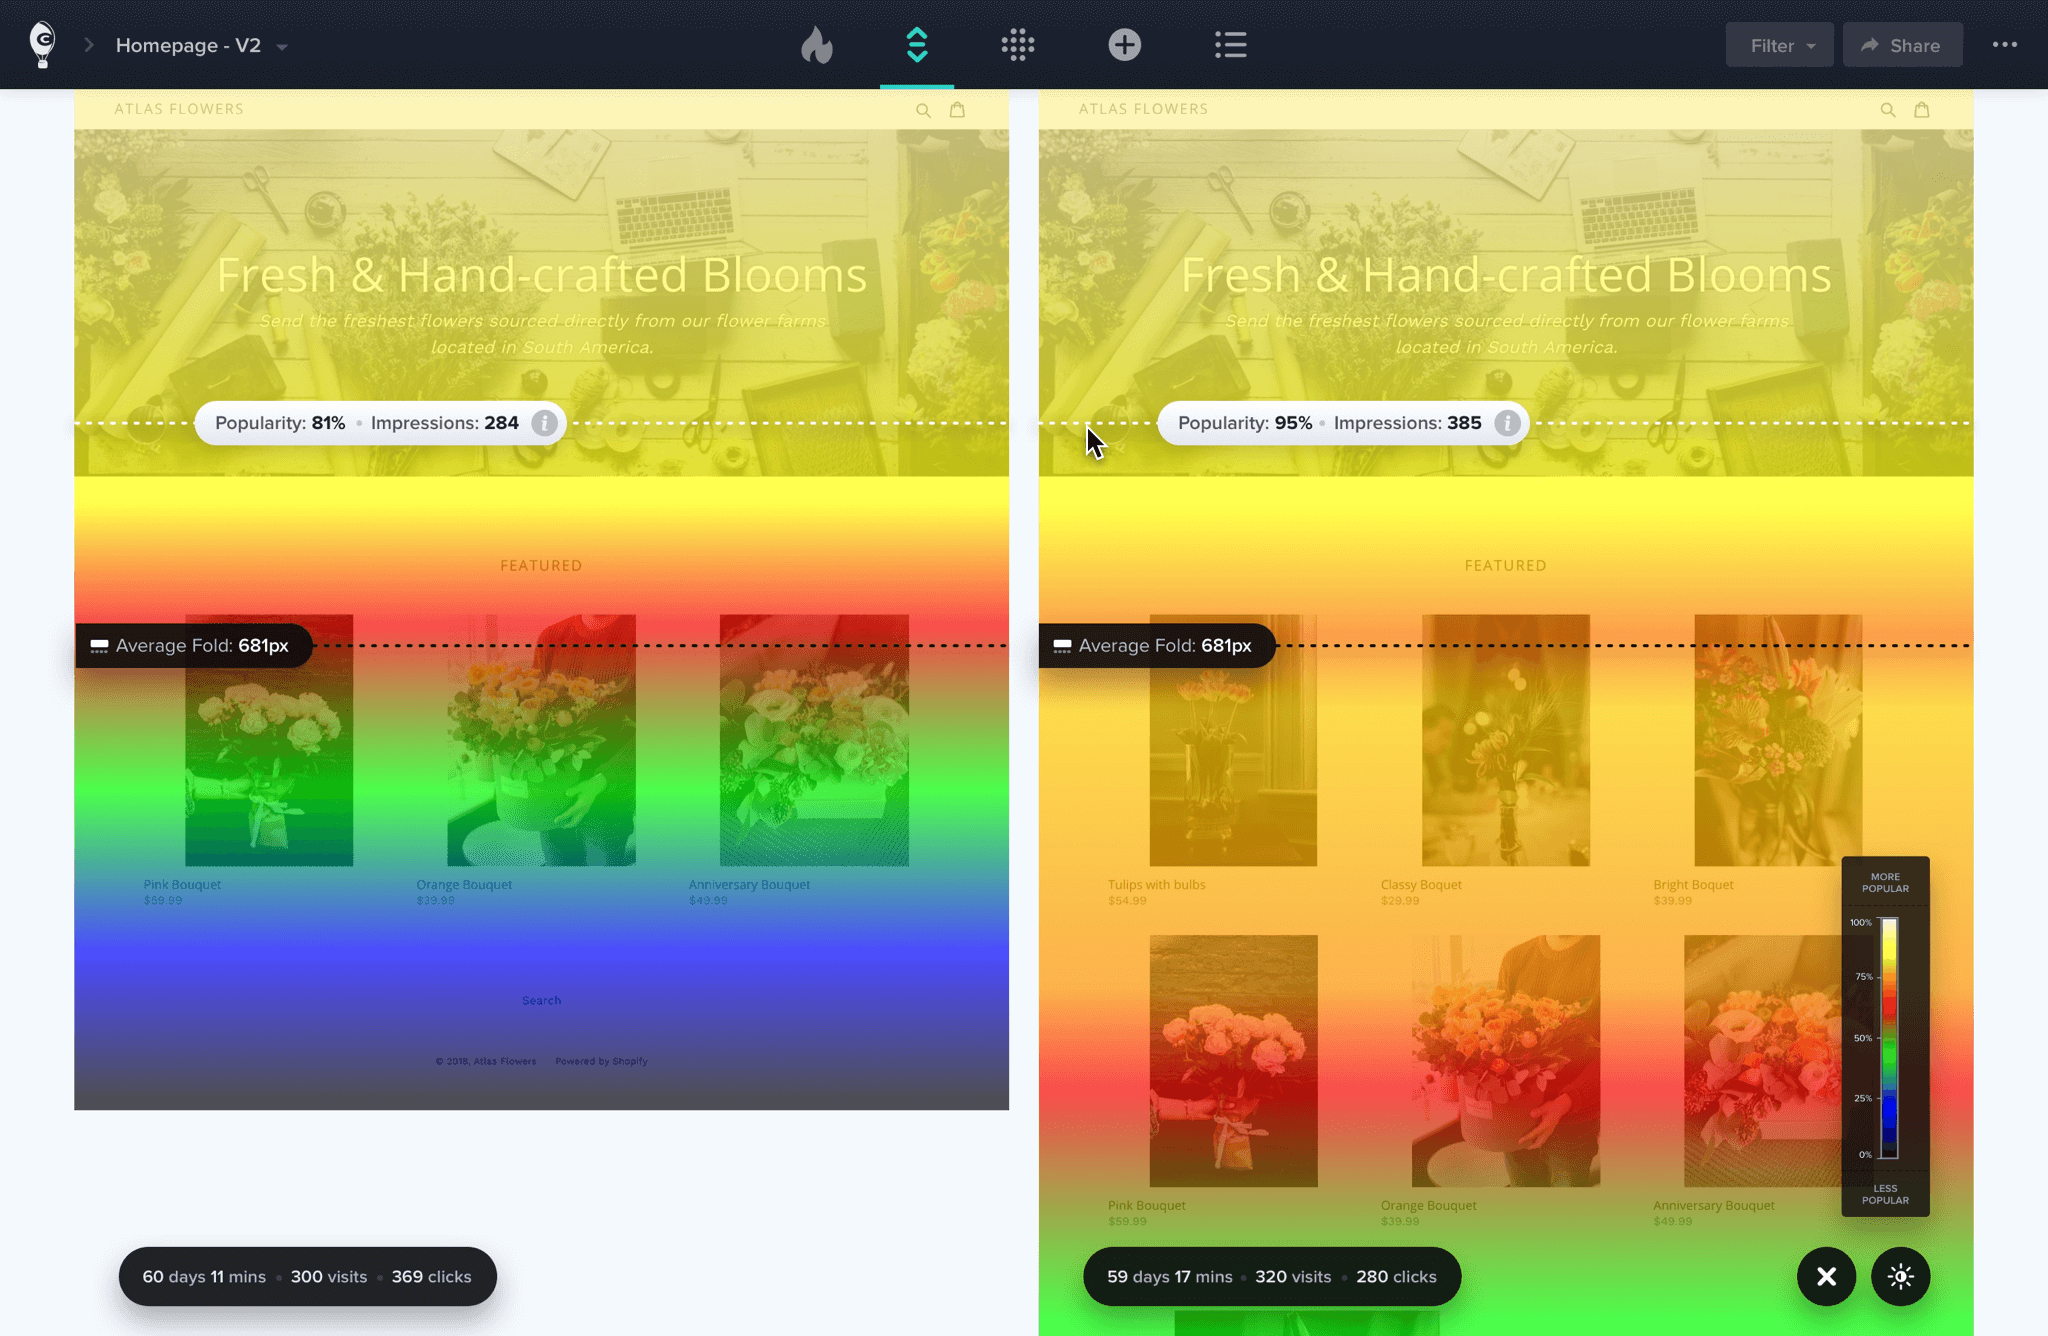
Heatmaps are powerful visual tools that illustrate how visitors interact with your ecommerce website by mapping areas of high and low engagement. Typically displayed as color-coded overlays, heatmaps use warm colors like red and orange to indicate hotspots where users click, scroll, or hover most frequently, while cooler colors like blue show less interaction. In the world of ecommerce, understanding these patterns is crucial because they reveal exactly what grabs your customers’ attention and what gets ignored. By analyzing heatmaps, you can identify which product images, call-to-action buttons, or promotional banners are performing well, and which elements may need improvement. This insight allows you to optimize your website layout, streamline the user experience, and ultimately increase conversions. Simply put, heatmaps offer a window into your customers’ behavior, turning raw data into actionable strategies that drive ecommerce success.

2. Types of Heatmaps: Click, Scroll, and Movement Analysis
Heatmaps are powerful visualization tools that help ecommerce businesses understand how visitors interact with their websites. There are three primary types of heatmaps—click, scroll, and movement heatmaps—each offering unique insights into customer behavior.
Click Heatmaps track where users are clicking on a webpage. By highlighting the most and least clicked areas, these heatmaps reveal which buttons, links, or images attract the most attention. This information allows businesses to optimize call-to-action placements, improve navigation, and identify any misleading or non-functional elements that may be hindering conversions.
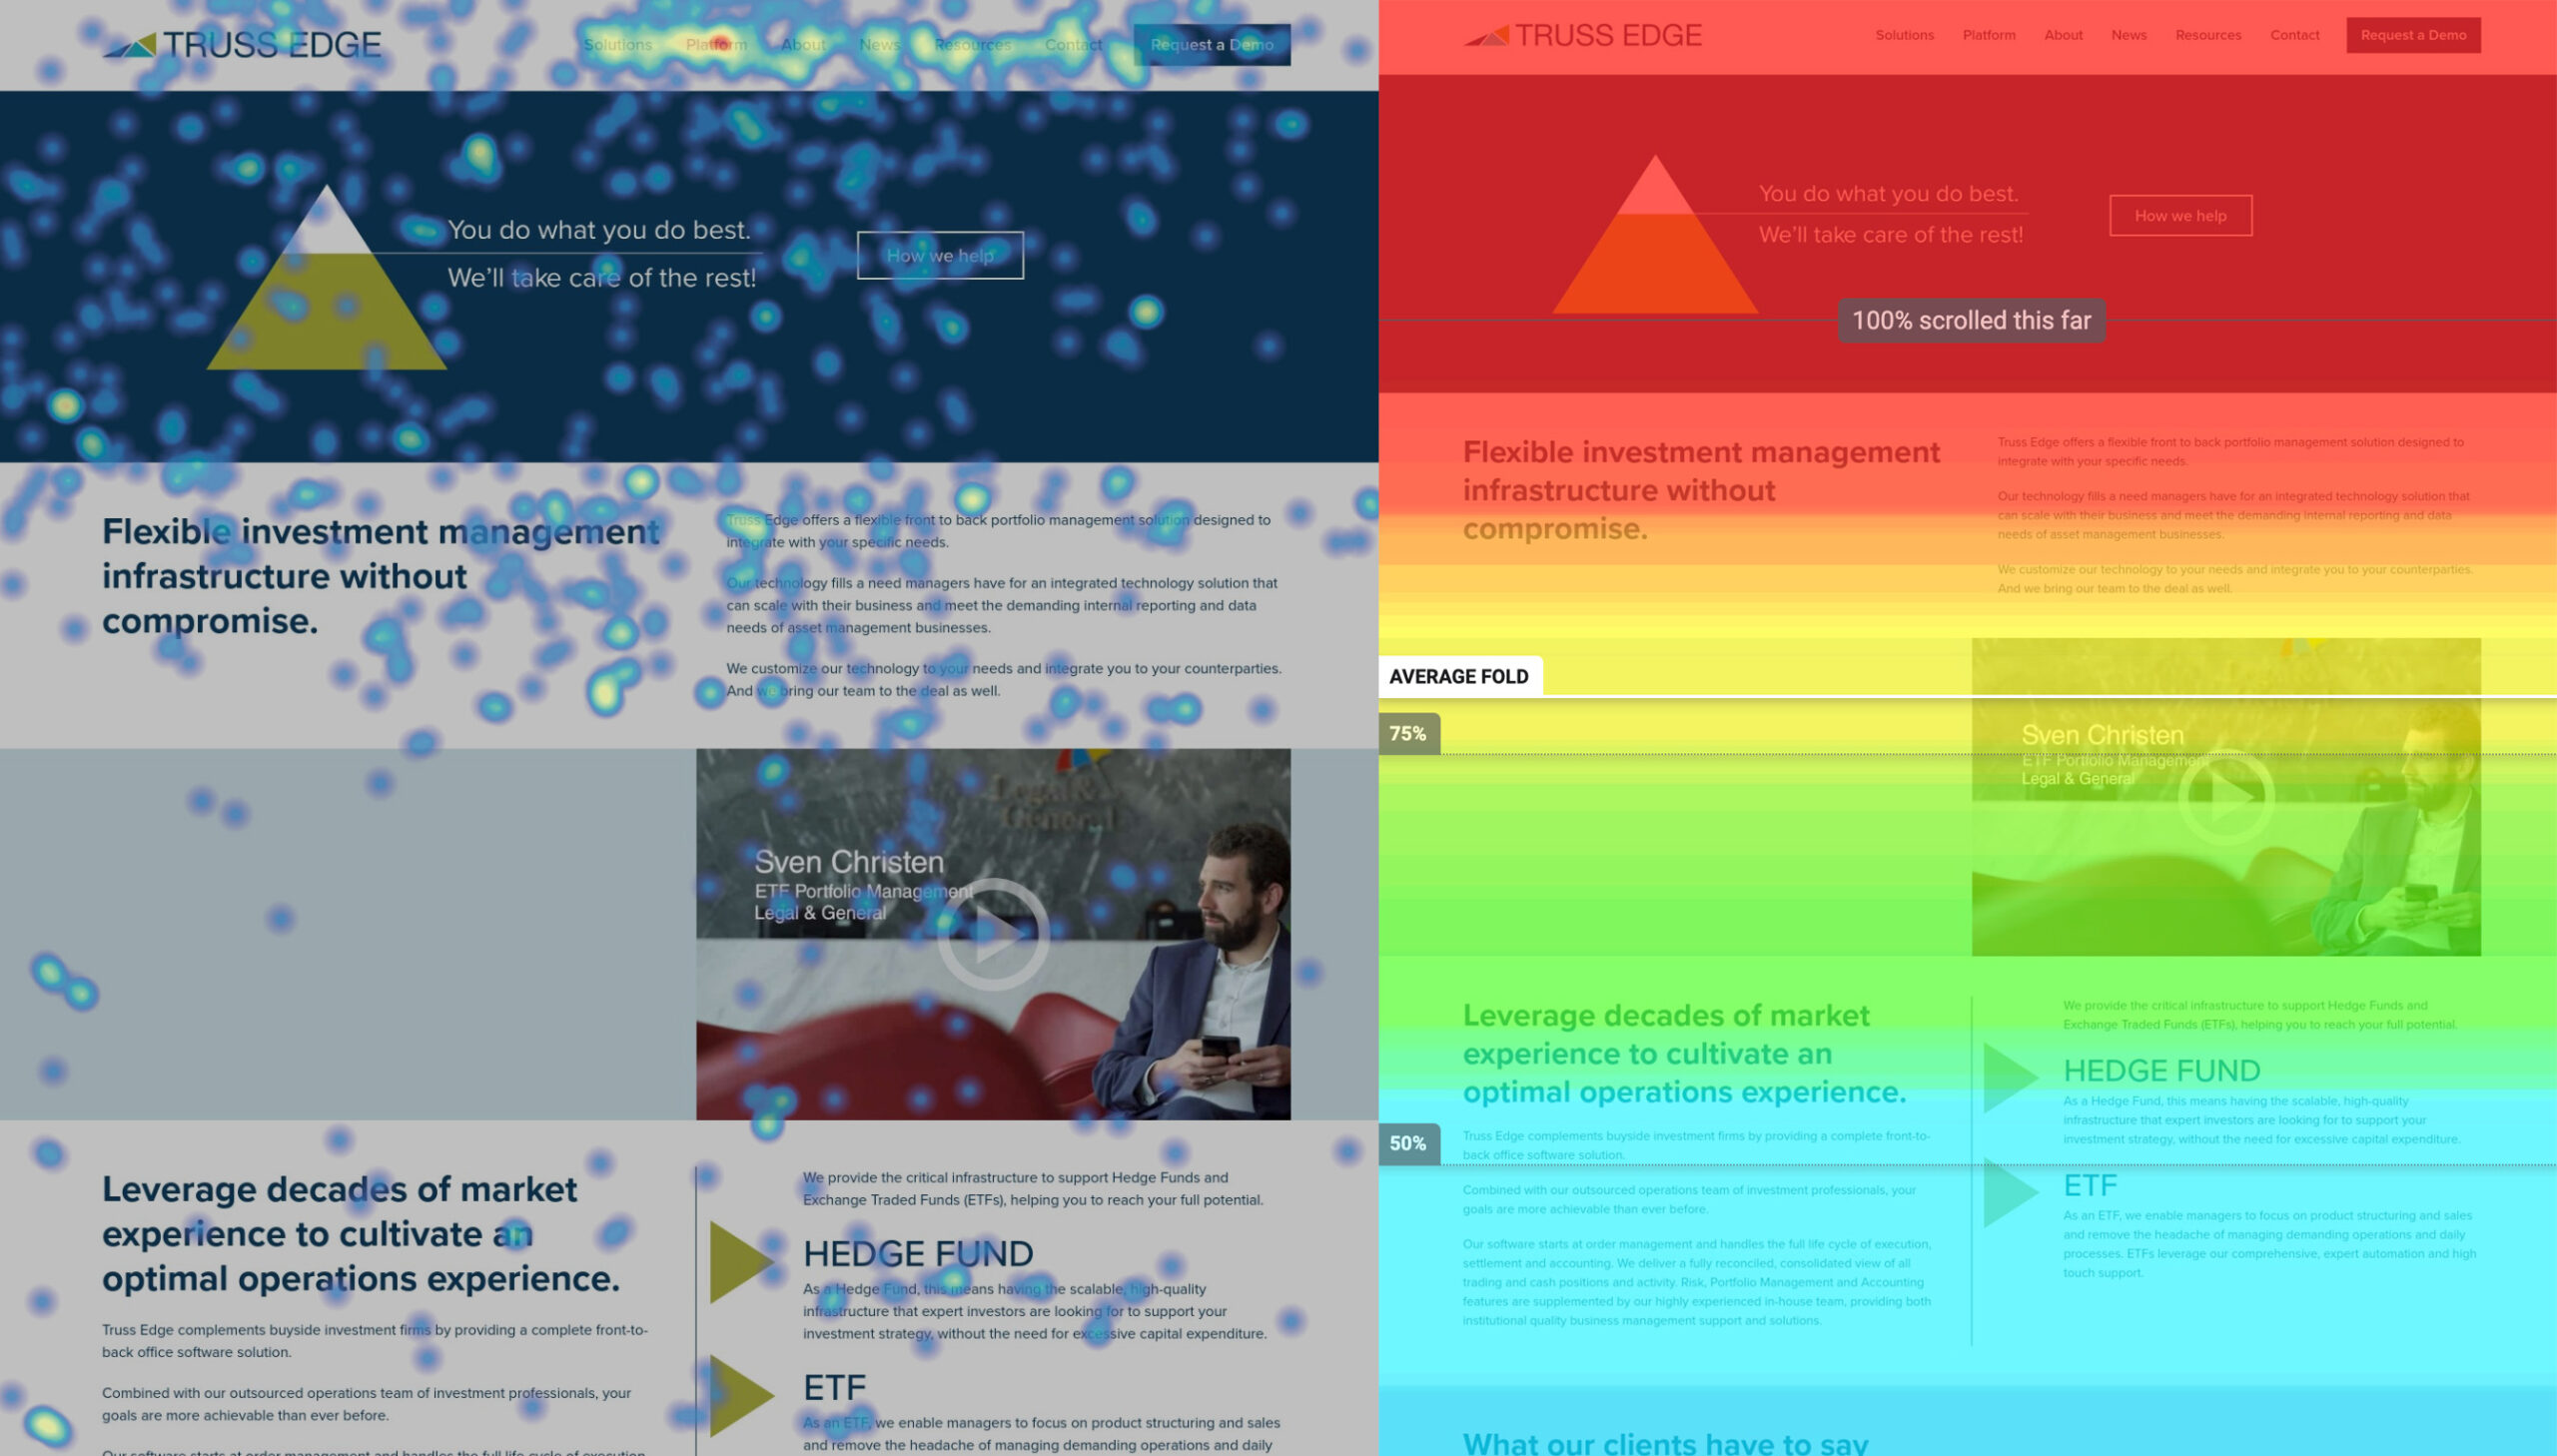
Scroll Heatmaps show how far down a page users scroll before leaving. This type of heatmap is invaluable for understanding whether visitors are engaging with your entire page or dropping off too early. If key content or offers are located too far down, scroll heatmaps can signal the need to rearrange or shorten page content to keep users engaged and drive more sales.
Movement Heatmaps track the movement of users’ cursors as they browse a page. Since cursor movement often correlates with eye movement, these heatmaps provide clues about where visitors focus their attention. Ecommerce sites can use this data to design more intuitive layouts, ensuring that important product details or promotions are placed where customers are most likely to notice them.
By leveraging these three types of heatmaps, ecommerce businesses can gain a comprehensive understanding of user behavior, enabling data-driven decisions that enhance user experience and boost conversions.
3. How to Interpret Heatmap Data to Understand Customer Behavior
Heatmaps are powerful visual tools that use color gradients to represent user interactions on your ecommerce website, such as clicks, scrolls, and mouse movements. Interpreting this data effectively can offer invaluable insights into how customers navigate your site, what captures their attention, and where they might encounter obstacles. When analyzing heatmaps, start by identifying the “hot zones” — areas with the highest concentration of clicks or engagement. These zones highlight the elements or products that pique user interest the most. Conversely, “cold zones” indicate sections that are often overlooked or ignored, signaling potential opportunities to optimize content placement or design. Pay close attention to scroll heatmaps to see how far down users typically explore your pages; if important information or call-to-action buttons are located in areas with low engagement, consider repositioning them higher. Additionally, heatmaps can reveal unexpected user behavior, such as clicking on non-clickable elements, which may suggest confusion or unmet user expectations. By combining these observations, you can fine-tune your website layout, improve navigation, and strategically place key content, ultimately enhancing the user experience and boosting conversion rates.
4. Using Heatmaps to Optimize Website Layout and User Experience
Using heatmaps to optimize your website layout and user experience is a game-changer for any ecommerce business aiming to boost conversions and customer satisfaction. Heatmaps visually represent where visitors click, scroll, and spend the most time on your site, providing invaluable insights into user behavior that traditional analytics often miss. By analyzing this data, you can identify which elements of your webpage capture attention and which areas are being ignored or causing friction. For example, if a heatmap reveals that users frequently click on a non-clickable banner or overlook your call-to-action buttons, it signals an opportunity to redesign these elements for better engagement. Additionally, heatmaps help you understand scrolling patterns, allowing you to place important content, promotions, and product highlights where they are most visible. Optimizing your layout based on heatmap insights ensures a smoother, more intuitive browsing experience that keeps customers engaged longer and guides them effortlessly toward making a purchase. Ultimately, leveraging heatmaps empowers you to make data-driven decisions that elevate both usability and sales performance on your ecommerce website.
5. Case Studies: Ecommerce Brands That Improved Sales with Heatmap Insights
Heatmaps have become an invaluable tool for ecommerce brands looking to understand their customers better and optimize their websites for higher conversions. Several successful companies have leveraged heatmap data to unlock key customer behavior insights, resulting in measurable improvements in sales and user experience.
Take, for example, a popular fashion retailer that used heatmaps to analyze how visitors interacted with their product pages. By observing where users clicked most frequently and how far they scrolled, the brand discovered that many shoppers were missing important size guide information placed below the fold. Armed with this insight, they repositioned the size guide higher on the page and added clear call-to-action buttons, leading to a 20% increase in completed purchases within just a few weeks.
In another case, an electronics ecommerce site employed heatmaps to track user attention on their homepage. The data revealed that visitors were consistently overlooking a featured promotion due to its placement in a less prominent area. By redesigning the homepage layout to highlight the promotion more effectively, the company experienced a significant boost in add-to-cart rates and overall revenue.
These examples demonstrate how heatmaps provide actionable insights into customer behavior that traditional analytics tools might miss. By visualizing exactly where users engage—or don’t engage—with your site, you can make informed decisions to enhance usability, tailor your content, and ultimately drive higher sales. Whether you’re a small startup or an established brand, incorporating heatmap analysis into your ecommerce strategy can be a game-changer in unlocking your store’s full potential.
6. Tools and Best Practices for Implementing Heatmaps on Your Ecommerce Site
Implementing heatmaps on your ecommerce site can provide invaluable insights into how visitors interact with your products and overall website layout. To get started, there are several powerful tools available that cater specifically to ecommerce businesses. Popular options include Hotjar, Crazy Egg, and Lucky Orange—each offering user-friendly interfaces and robust features such as click tracking, scroll maps, and session recordings. When selecting a heatmap tool, consider factors like integration capabilities with your ecommerce platform, ease of use, and the depth of analytics provided.
Once you have chosen your tool, it’s important to follow best practices to maximize the value of your heatmap data. Begin by defining clear goals—whether it’s understanding why visitors abandon their carts or identifying which product images attract the most attention. Set up heatmaps on key pages such as the homepage, product pages, and checkout process to gather comprehensive insights. Regularly review heatmap reports in conjunction with other analytics data to spot trends and patterns. Finally, use these findings to run A/B tests and optimize page layouts, call-to-action buttons, and content placement, ensuring a smoother and more engaging shopping experience that drives conversions. By combining the right tools with a strategic approach, heatmaps can become a cornerstone of your ecommerce optimization efforts.
7. Combining Heatmaps with Other Analytics Tools for Deeper Insights
While heatmaps provide a vivid visual representation of how customers interact with your ecommerce website, their true power is unlocked when combined with other analytics tools. Integrating heatmaps with tools like Google Analytics, session recordings, and conversion funnels offers a more comprehensive understanding of customer behavior. For instance, while heatmaps show where users click or scroll, Google Analytics can reveal the demographics, traffic sources, and bounce rates associated with those interactions. Session recordings allow you to watch real-time user journeys, highlighting frustrations or confusion that heatmaps alone might not capture. Additionally, analyzing conversion funnels alongside heatmap data helps identify specific stages where users drop off, enabling you to optimize those points effectively. By leveraging these tools in tandem, you gain deeper insights that empower you to make data-driven decisions—enhancing user experience, increasing engagement, and ultimately boosting sales on your ecommerce website.
8. Leveraging Heatmap Insights to Drive A/B Testing and Conversion Optimization
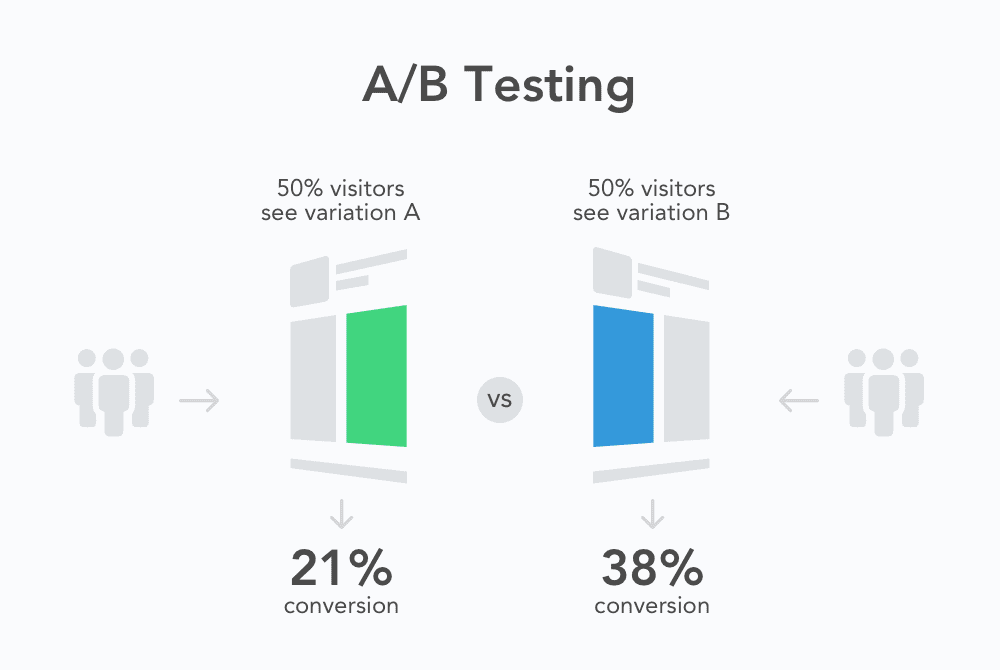
Heatmaps provide a visual representation of how visitors interact with your ecommerce website, highlighting which areas attract the most attention and which parts are often overlooked. By analyzing these patterns, you gain valuable insights into customer behavior that can directly inform your A/B testing strategies. For example, if a heatmap reveals that users rarely click on a particular call-to-action (CTA) button, you can experiment with different colors, placements, or wording in your A/B tests to see what resonates best with your audience. Similarly, if certain product images or descriptions receive high engagement, you might test variations that emphasize those elements more prominently. This data-driven approach ensures that your optimization efforts are focused on real user behavior rather than guesswork, ultimately improving your conversion rates. By continuously iterating based on heatmap insights, you can create a more intuitive and persuasive shopping experience that guides customers smoothly through the sales funnel, boosting both sales and customer satisfaction.
If you need help with your websites conversion rates, contact us for a FREE CRO Audit