
Understanding how visitors navigate through your website is crucial to optimizing their experience and ultimately increasing your conversion rates. Mastering user flow analysis in Google Analytics provides invaluable insights into the paths users take, where they drop off, and which pages effectively guide them toward your goals. In this blog post, we’ll dive deep into the fundamentals of user flow analysis, explore practical strategies to interpret the data, and share actionable tips to help you identify bottlenecks and enhance your website’s performance. Whether you’re a seasoned marketer or just getting started, mastering this powerful tool can transform the way you approach conversion optimization and drive meaningful results for your business.
1. Understanding User Flow in Google Analytics
Understanding User Flow in Google Analytics is essential for anyone looking to optimize their website and boost conversion rates. User Flow is a visual representation of the paths visitors take through your site—from the moment they land on a page, through various interactions, to their exit points. This powerful tool helps you see how users navigate your content, which pages keep them engaged, and where they drop off. By analyzing these pathways, you can identify bottlenecks, confusing navigation, or content gaps that may be hindering conversions. Google Analytics presents this data in an intuitive flowchart format, allowing you to trace the journey of different user segments and understand their behavior patterns. With a clear grasp of User Flow, you can make informed decisions to streamline the user experience, optimize landing pages, and ultimately guide visitors more effectively toward your desired actions—whether that’s making a purchase, signing up for a newsletter, or any other conversion goal.
2. Setting Up and Accessing User Flow Reports
To effectively harness the power of user flow analysis in Google Analytics, the first step is setting up and accessing the User Flow reports. Fortunately, Google Analytics provides these reports by default, so no additional setup is required beyond having your website properly integrated with GA. To access the User Flow report, log in to your Google Analytics account and navigate to the left-hand menu. Under the “Audience” section, you’ll find “User Flow.” Clicking on this will open a visual representation of the paths users take through your website, illustrating how they navigate from one page or event to another.
Before diving into the data, ensure your tracking is correctly configured to capture all relevant user interactions, such as pageviews, events, and goals. This comprehensive tracking will provide richer insights into user behavior. Additionally, you can customize the User Flow report by selecting specific segments, traffic sources, or user dimensions to analyze different user groups or campaigns in detail. By familiarizing yourself with this report, you’ll be better equipped to identify drop-off points, popular paths, and potential bottlenecks that directly influence your conversion rates. This foundational step sets the stage for deeper analysis and strategic optimizations to enhance user experience and drive more successful outcomes.
3. Interpreting User Flow Data to Identify Drop-off Points
Interpreting user flow data in Google Analytics is a crucial step in understanding how visitors navigate through your website and where they might be encountering obstacles. By closely examining the paths users take from one page or event to another, you can pinpoint specific drop-off points—moments where visitors abandon the site or fail to continue toward conversion goals. These drop-offs often highlight friction areas such as confusing navigation, slow-loading pages, or unclear calls to action. To effectively identify these points, focus on segments with high exit rates or sudden declines in user progression within key funnels. Once identified, you can prioritize optimizing these pages or steps by improving content clarity, streamlining the user interface, or simplifying the checkout process. By leveraging user flow analysis to uncover and address drop-off points, you create a smoother, more intuitive journey that ultimately boosts your conversion rates and drives business growth.
4. Strategies to Optimize User Flow for Higher Conversions
Optimizing user flow is essential for guiding visitors seamlessly through your website and ultimately boosting your conversion rates. One effective strategy is to identify and eliminate bottlenecks in your user journey. By analyzing drop-off points within Google Analytics’ user flow reports, you can pinpoint where users are abandoning the process and take targeted actions to improve those areas. For example, simplifying navigation menus, reducing the number of form fields, or enhancing page load speed can significantly minimize friction. Another key approach is to create clear and compelling calls-to-action (CTAs) that direct users toward desired outcomes. Placing CTAs strategically at critical junctures—such as after engaging content or product pages—helps maintain momentum and encourages users to take the next step. Additionally, personalizing user pathways based on behavior or demographics can make the experience more relevant and engaging, increasing the likelihood of conversion. Regularly testing different layouts, content, and flow sequences through A/B testing can also provide invaluable insights into what resonates best with your audience. By combining these strategies, you can create an intuitive, efficient user flow that not only retains visitors but converts them into loyal customers.

5. Case Studies: Real-Life Examples of User Flow Improvements
To truly understand the power of user flow analysis in Google Analytics, it’s helpful to look at real-life examples where businesses have leveraged this tool to significantly boost their conversion rates. One notable case involved an online retail store struggling with a high cart abandonment rate. By analyzing the user flow, they identified a bottleneck where many users dropped off during the checkout process. With this insight, they simplified the checkout steps, removed unnecessary form fields, and optimized page load times. As a result, the store saw a 25% increase in completed purchases within just two months.
Another example comes from a SaaS company that noticed a large percentage of visitors were leaving after viewing the pricing page. Through user flow analysis, they discovered users were not easily navigating to the signup page. By adding clear, prominent calls-to-action and streamlining the navigation path, the company improved the flow and increased free trial signups by 30%.
These case studies demonstrate how understanding and optimizing user flow can reveal hidden issues and opportunities within your website, enabling you to create a smoother, more intuitive journey that guides visitors towards conversion. Whether it’s simplifying steps, improving navigation, or addressing drop-off points, user flow analysis in Google Analytics is an invaluable resource for driving tangible business results.
6. Tips and Best Practices for Ongoing User Flow Analysis
To truly master user flow analysis in Google Analytics and continuously boost your conversion rates, it’s essential to adopt a strategic approach that emphasizes regular monitoring, thoughtful interpretation, and actionable insights. Start by setting clear goals aligned with your business objectives—whether it’s increasing sign-ups, purchases, or engagement—so you can focus your analysis on the most impactful user journeys. Make it a habit to review your user flow reports frequently, looking out for any unexpected drop-offs, bottlenecks, or loops that might indicate friction points in your site’s navigation. Use segmentation to drill down into specific user groups, such as new vs. returning visitors or traffic from different marketing channels, to uncover tailored opportunities for optimization. Additionally, complement quantitative data with qualitative feedback by integrating user surveys or heatmaps, giving you a well-rounded understanding of user behavior. Remember, user flow analysis is not a one-time task but an ongoing process—by continuously testing hypotheses, implementing changes, and measuring results, you can refine your website experience and steadily improve conversion rates over time.
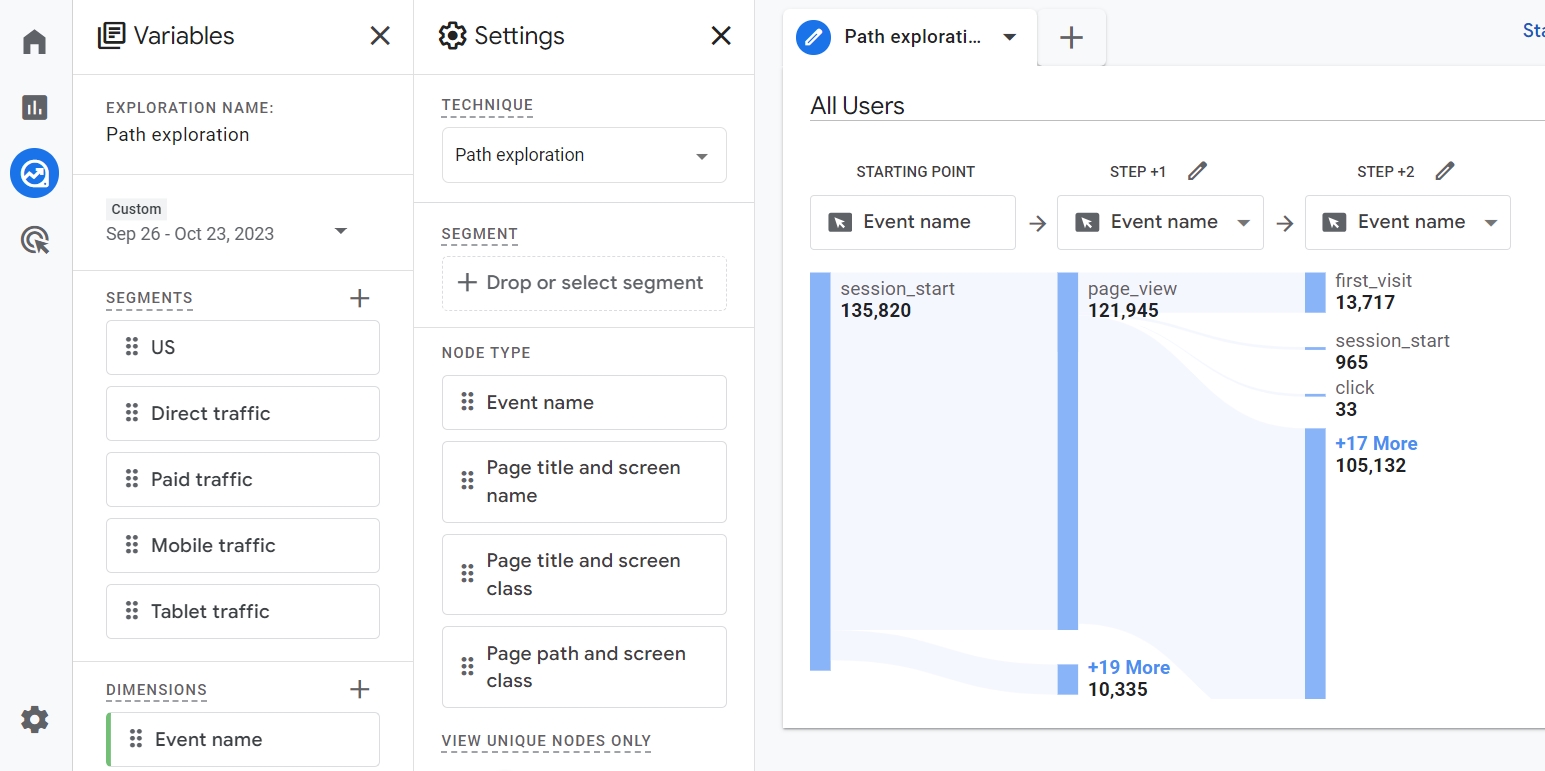
7. Leveraging GA4 Path Exploration for Deeper Journey Insights
One of the most powerful features in Google Analytics 4 (GA4) for understanding user behavior is the Path Exploration report. This tool allows you to visualize the exact paths users take on your website, providing granular insights into their journey from entry to conversion—or where they might be dropping off. By leveraging GA4’s Path Exploration, you can identify common navigation patterns, uncover unexpected behavior flows, and spot bottlenecks that hinder conversions. For instance, you might discover that a significant portion of users navigates from a product page to the FAQ section before making a purchase decision, highlighting the importance of clear and accessible information. Additionally, the interactive nature of Path Exploration lets you drill down into specific touchpoints, segment users based on their actions, and compare different user flows to optimize your site’s layout and content strategically. Ultimately, mastering this feature empowers you to make data-driven decisions that enhance user experience and significantly boost your conversion rates.
8. Integrating User Flow Insights with Other CRO Tools
Integrating user flow insights from Google Analytics with other Conversion Rate Optimization (CRO) tools can significantly enhance your ability to understand and improve your website’s performance. While Google Analytics provides a comprehensive overview of how users navigate through your site, combining this data with tools like heatmaps, session recordings, and A/B testing platforms offers a more nuanced perspective on user behavior. For instance, heatmaps can visually highlight where users click, scroll, or hesitate, helping you interpret the friction points revealed by user flow analysis. Session recordings allow you to observe real-time user interactions, providing context to the paths users take and the obstacles they encounter. Meanwhile, A/B testing tools empower you to experiment with different page layouts or content variations based on insights gathered from your user flow data, enabling data-driven decisions to optimize conversion funnels. By integrating these tools, you create a holistic CRO strategy that not only identifies where users drop off but also uncovers why, giving you the actionable insights needed to boost your conversion rates effectively.
If you found this article helpful and need help with your website conversion, contact us for a FREE CRO Audit