In the fast-paced world of digital marketing, understanding your website’s performance is crucial for driving meaningful results. Google Analytics offers a wealth of data that, when used effectively, can transform your conversion rate optimization (CRO) strategy. However, with so many reports and metrics available, it can be overwhelming to know where to focus your attention. In this post, we’ll explore the top Google Analytics reports that provide valuable insights into user behavior, traffic sources, and conversion funnels—empowering you to make data-driven decisions that boost your conversion rates and maximize your marketing efforts. Whether you’re a beginner or looking to refine your CRO tactics, this guide will help you leverage Google Analytics to its fullest potential.
1. Audience Overview Report: Understanding Your Visitors
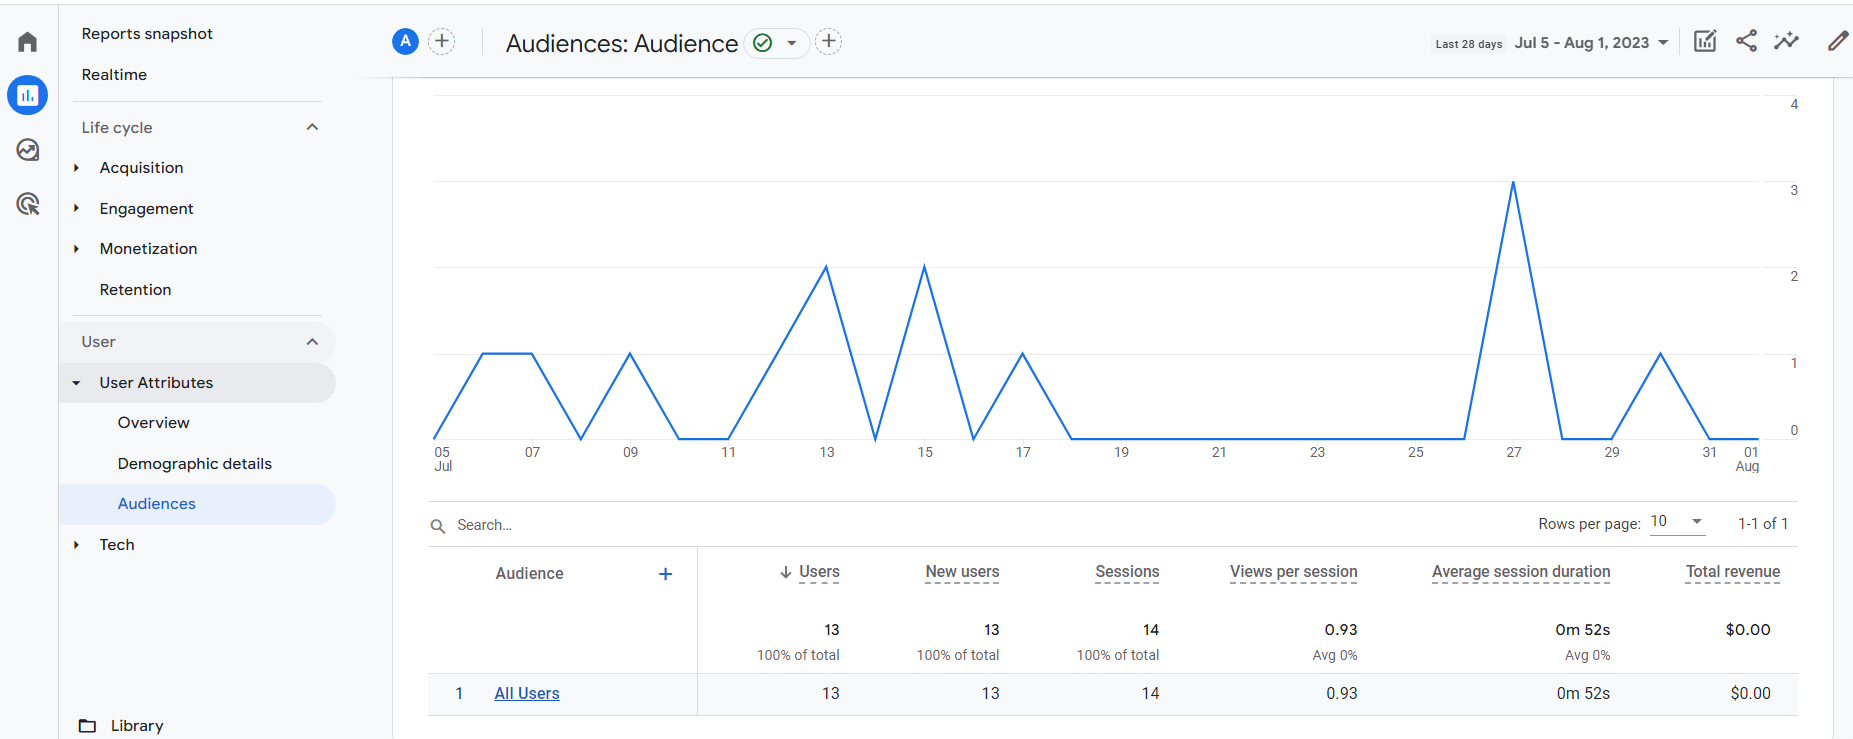
The Audience Overview Report in Google Analytics is an essential starting point for understanding who your website visitors are and how they interact with your site. This report provides a comprehensive snapshot of key metrics such as the number of users, sessions, pageviews, average session duration, bounce rate, and new versus returning visitors. By analyzing these data points, you can gain valuable insights into your audience’s behavior and engagement levels. For example, a high bounce rate might indicate that visitors aren’t finding what they’re looking for, signaling a need to optimize your landing pages. Additionally, the report breaks down demographics like age, gender, location, and device usage, enabling you to tailor your marketing strategies and website experience more effectively. Understanding these attributes helps you create targeted content, improve user experience, and ultimately increase your conversion rates. In short, the Audience Overview Report acts as your window into the minds of your visitors, providing the foundational knowledge necessary to craft data-driven optimization efforts.
2. Acquisition Reports: Identifying High-Performing Traffic Sources
Acquisition reports in Google Analytics are essential tools for understanding where your website traffic is coming from and which sources are driving the most valuable visitors. By diving into these reports, you can identify high-performing traffic sources—whether they be organic search, paid ads, social media, email campaigns, or referral links—that are contributing significantly to your conversion goals. Knowing which channels bring in engaged users allows you to allocate your marketing budget more effectively and tailor your strategies to amplify those successful sources. For instance, if organic search is driving a steady stream of conversions, investing in SEO efforts can yield even greater returns. Similarly, if a specific social media platform is proving to be a top performer, doubling down on content and advertising there can boost your overall conversion rates. Acquisition reports also help you pinpoint underperforming channels, giving you the insights needed to optimize or rethink your approach. By leveraging these insights, you can make data-driven decisions to enhance your conversion rate optimization efforts and ultimately grow your ecommerce business.
3. Behavior Flow Report: Analyzing User Navigation Paths
The Behavior Flow report in Google Analytics is a powerful tool that helps you visualize the path users take as they navigate through your website. By analyzing these user navigation paths, you can gain valuable insights into how visitors interact with your content, which pages capture their attention, and where they tend to drop off. This report displays a flowchart that maps out the most common routes users follow from one page or event to the next, allowing you to identify potential bottlenecks or areas causing friction in the user journey.
Understanding the Behavior Flow enables you to pinpoint which pages are effectively guiding visitors toward conversion goals and which ones may need optimization to improve engagement. For example, if you notice a significant drop-off on a crucial landing page, it may indicate confusing navigation, slow load times, or content that doesn’t meet user expectations. By addressing these issues, you can streamline the user experience, reduce bounce rates, and ultimately boost your conversion rates. Leveraging the insights from the Behavior Flow report empowers you to make data-driven decisions that enhance the overall effectiveness of your website’s conversion funnel.
4. Conversion Funnel Visualization: Tracking User Progression
Conversion Funnel Visualization is a powerful feature in Google Analytics that allows you to track the journey users take as they move through the various stages of your conversion process. By mapping out each step—from initial site visit to completing a purchase or desired action—you gain valuable insights into where users drop off and where they continue smoothly toward conversion. This visual representation helps identify bottlenecks or barriers within the funnel, such as a complicated checkout process or unclear call-to-action buttons, enabling you to make data-driven decisions to improve user experience. With Conversion Funnel Visualization, you can pinpoint exactly which stages need optimization, test different strategies, and ultimately increase your conversion rates by guiding more visitors seamlessly toward your goals. Tracking user progression through this funnel is essential for understanding customer behavior, optimizing marketing efforts, and maximizing the return on your digital investments.
5. Landing Pages Report: Optimizing Entry Points for Conversions
The Landing Pages Report in Google Analytics is an invaluable tool for understanding how visitors first interact with your website. By analyzing which pages serve as entry points, you can identify the most effective landing pages and uncover opportunities for improvement. This report provides detailed metrics such as bounce rate, average session duration, and conversion rates for each landing page, enabling you to assess how well these pages engage your audience and drive desired actions. Optimizing your landing pages based on this data—whether by refining headlines, improving load times, or enhancing call-to-action elements—can significantly boost your conversion rates. Ultimately, the Landing Pages Report empowers you to tailor your entry points to better meet visitor expectations, guiding them smoothly through the customer journey and increasing the likelihood of conversion.
6. Goal and E-commerce Reports: Measuring and Enhancing Conversion Success
When it comes to boosting your conversion rate optimization (CRO) efforts, Goal and E-commerce reports in Google Analytics serve as indispensable tools for measuring and enhancing your success. These reports provide detailed insights into how well your website is performing in terms of meeting specific business objectives, such as newsletter sign-ups, form submissions, or product purchases.
Goal reports allow you to track user actions that matter most to your business by setting up customized goals tailored to your conversion funnels. Whether it’s completing a contact form or spending a certain amount of time on a key page, these reports help you understand where users are dropping off and which paths lead to successful conversions. By analyzing Goal Flow and Goal Completion data, you can identify bottlenecks or opportunities for improvement within the customer journey.
On the other hand, E-commerce reports dive deep into your online sales performance by tracking transactions, revenue, average order value, and product-specific metrics. These reports allow you to pinpoint your top-selling products, understand customer purchasing behavior, and evaluate the effectiveness of your marketing campaigns. With features like Product Performance, Sales Performance, and Shopping Behavior reports, you gain a comprehensive view of the purchasing process—from product views to final checkout.
Together, Goal and E-commerce reports empower you to make data-driven decisions that refine your CRO strategies. By continuously monitoring and optimizing based on these insights, you can enhance user experience, increase conversion rates, and ultimately drive greater revenue for your e-commerce business.
7. Site Speed Report: Identifying Performance Bottlenecks That Affect Conversions
One of the most critical yet often overlooked factors impacting your website’s conversion rate is site speed. The Site Speed Report in Google Analytics provides valuable insights into how quickly your pages load and helps you identify performance bottlenecks that may be frustrating visitors and causing them to abandon your site. Slow-loading pages can lead to higher bounce rates, lower user engagement, and ultimately, fewer conversions. By analyzing metrics such as average page load time, server response time, and page timing for individual URLs, you can pinpoint specific areas where your site is lagging. For example, if you notice that certain pages consistently have longer load times compared to others, this could indicate issues with large image files, unoptimized scripts, or server delays. Using this data, you can prioritize technical optimizations—like compressing images, leveraging browser caching, or refining your hosting setup—to enhance site performance. Improving site speed not only elevates the user experience but also boosts your SEO rankings and conversion rates, making the Site Speed Report an indispensable tool in your CRO arsenal.
8. Custom Reports and Segments: Unlocking Deeper, Actionable Insights
One of the most powerful features of Google Analytics that often goes underutilized is the ability to create custom reports and segments. These tools allow you to go beyond the standard data views and tailor your analysis to focus on the specific behaviors and characteristics that matter most to your business goals. Custom reports enable you to compile the exact metrics and dimensions you want to track in a single, easy-to-understand dashboard. Whether you’re interested in tracking user engagement, conversions by traffic source, or the performance of specific landing pages, custom reports help you organize this data efficiently.
Similarly, segments allow you to isolate and analyze subsets of your traffic based on criteria such as demographics, behavior, traffic source, or conversion actions. By applying segments, you can uncover hidden trends and patterns that might be lost in aggregate data. For example, you might create a segment to analyze users who abandoned their shopping cart, and then identify commonalities in their behavior or acquisition channels. These insights empower you to make targeted optimizations — from refining your marketing campaigns to enhancing user experience on your site — ultimately driving higher conversion rates. Embracing custom reports and segments is essential for any marketer serious about leveraging data-driven strategies to boost their website’s performance.
If you found this article helpful and need help with your website conversion, contact us for a FREE CRO Audit
